Portfolio Analytics
See spend, work-order volume, compliance, and performance across the entire portfolio.

See spend, risk, compliance, and performance across every region and location, without waiting days for someone to compile the numbers.
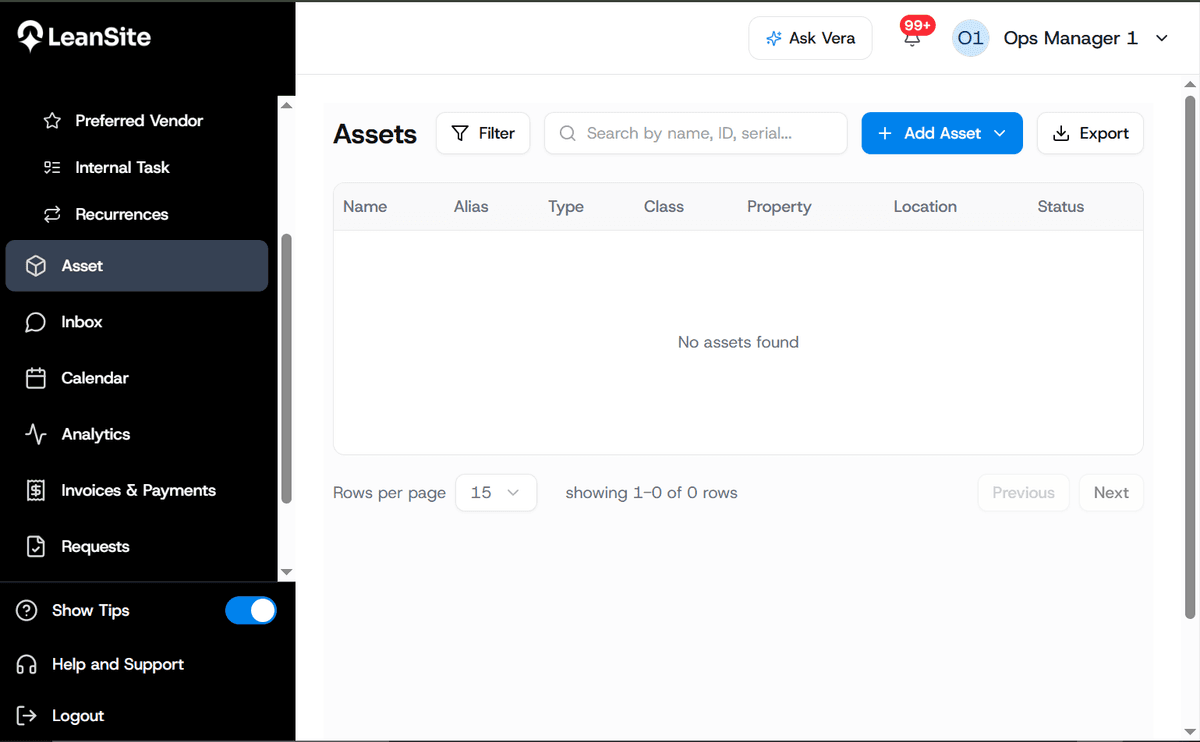
Portfolio summary — this quarter





This is the same drill-down we'd walk you through live spot the underperforming region, find the cause, and pull the report.
Step 1 of 5
Open the portfolio view
Every region and location in one place, with spend, risk, and compliance already rolled up.
Know which region is drifting before it shows up as a bad quarter.
Regional comparison — trailing 90 days
25%
Reactive spend as share of total maintenance spend
80%
Faster to produce a portfolio-wide report
5%
Average budget variance across the portfolio
Built for the view from the top
See spend, work-order volume, compliance, and performance across the entire portfolio.

Compare regions side by side to identify who's outperforming and where intervention is needed.
Track actual spend against budget and understand what's driving variance.
See whether locations are staying ahead of maintenance or constantly responding to emergencies.

Understand which vendors are driving cost, delays, repeat work, or strong outcomes.

See where documentation, inspections, or required work may expose the organization.
How executives actually use it

See it in the data before it turns into a bad quarter or an escalation from the field.

Show the actual cost curve over time instead of asking for more budget on instinct.
See when too much spend or too many locations depend on a single vendor relationship.

Answer “are we audit-ready” for the whole portfolio without calling five regional managers.

No emailing five people for numbers that all define “on time” differently.

Same metrics, same definitions, every location so a comparison actually means something.
We were spending thousands each month juggling multiple vendors. With Leansite's centralized dashboard, we now track, manage, and approve work orders in one place. The cost savings and efficiency gains have been incredible.
Not the right seat?
Bring your regions, your budget, your board deck. We'll show you what the report looks like already built.