
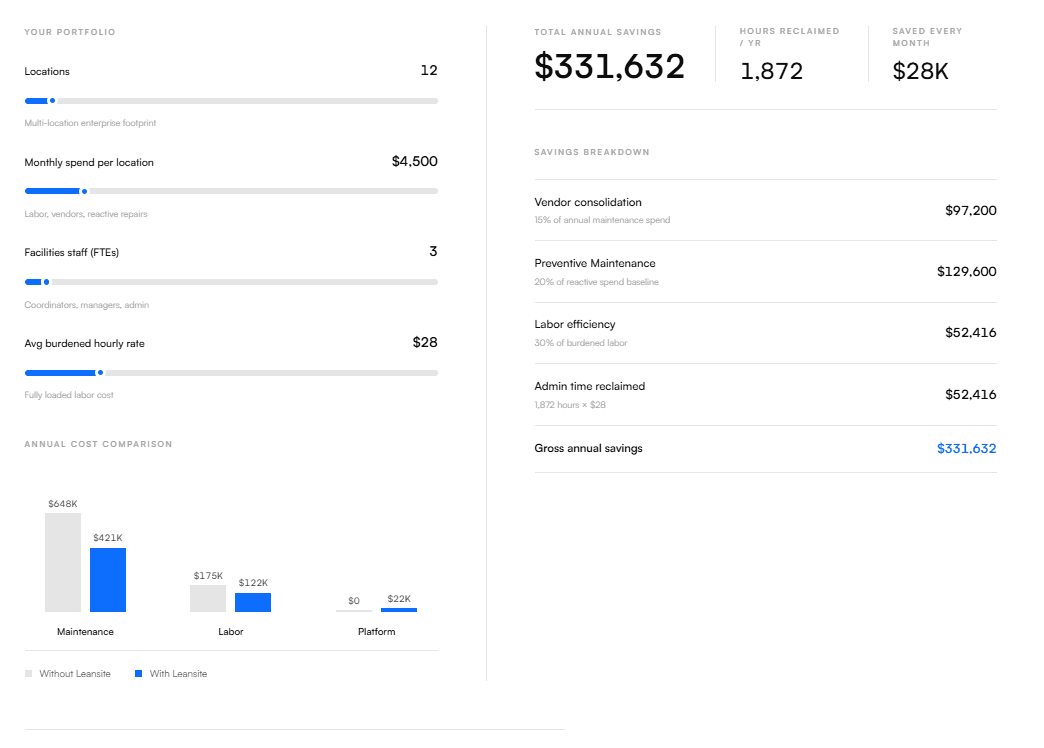
Budget & NTE Controls
Hard stops before a job goes over, not a report that arrives after the money's already spent.
The waste in most facilities budgets isn't hiding in the preventive maintenance protecting your buildings. It's hiding in the reactive repairs, padded labor hours, and vendor markups nobody's tracking. Cut those, and service goes up, not down.





The instinct when budgets are tight is to trim preventive maintenance. That's exactly backwards, the research is consistent on this.
Reactive repairs
3–5x
More expensive than the same work done as scheduled preventive maintenance, labor premiums, rush parts, and cascading damage from letting things break first.
Preventive maintenance
12–18%
Typical reduction in total maintenance cost when a facility shifts toward a real preventive program, with occupant satisfaction going up, not down, alongside it.
The instinct is to cut PM frequency portfolio-wide. The data says something different.
Step 1 of 5
Over budget
The portfolio ran over this quarter.
What changes when spend is tied to the work
X%
Reduction in reactive work order volume
Unchanged
Completion rate and response time, the proof service wasn't cut
X%
Reduction in total maintenance spend
Eight real capabilities, working together, not one feature wearing a lot of different hats.
Hard stops before a job goes over, not a report that arrives after the money's already spent.
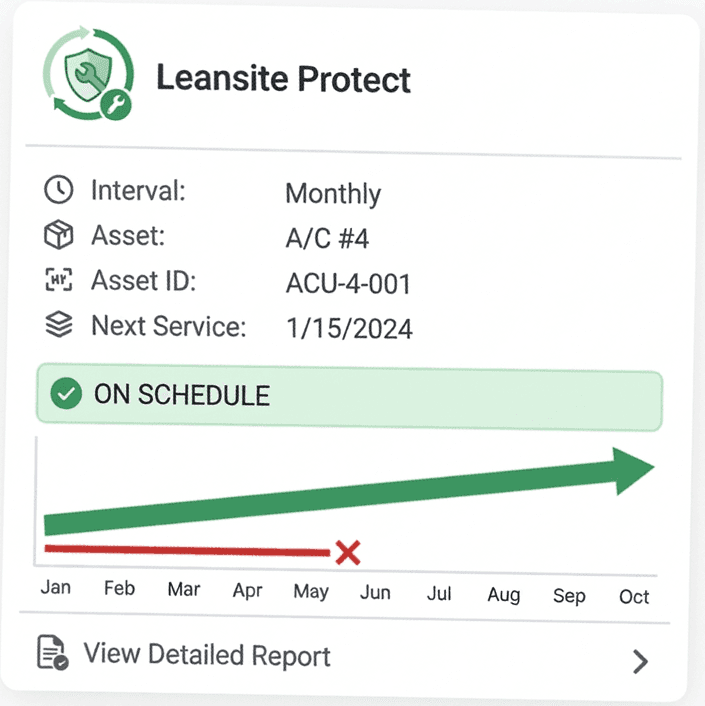
Protect the PM cadence that's actually preventing the expensive reactive work in the first place.
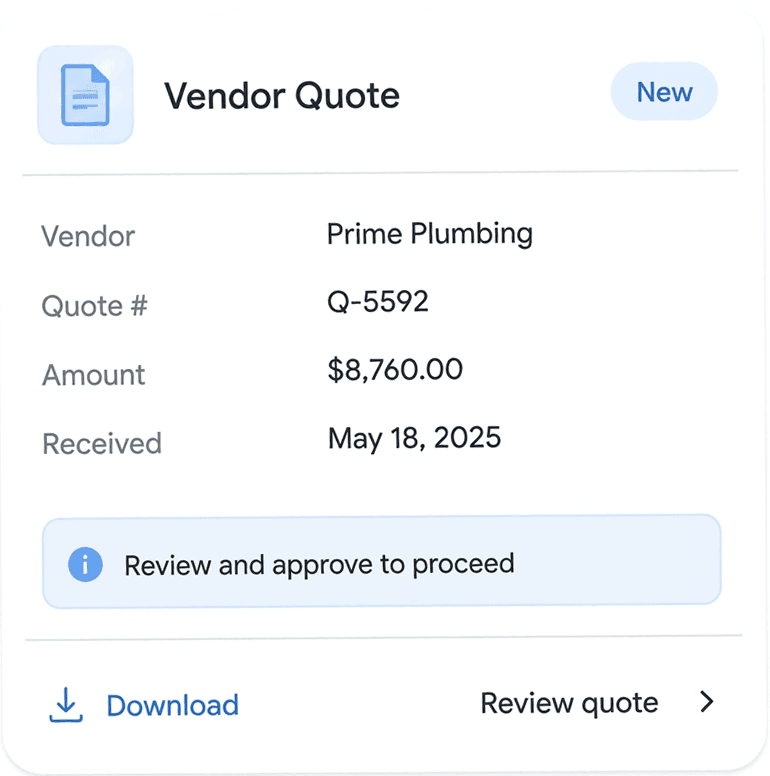
Competitive quotes lower job cost by changing the price, not the person doing the work.
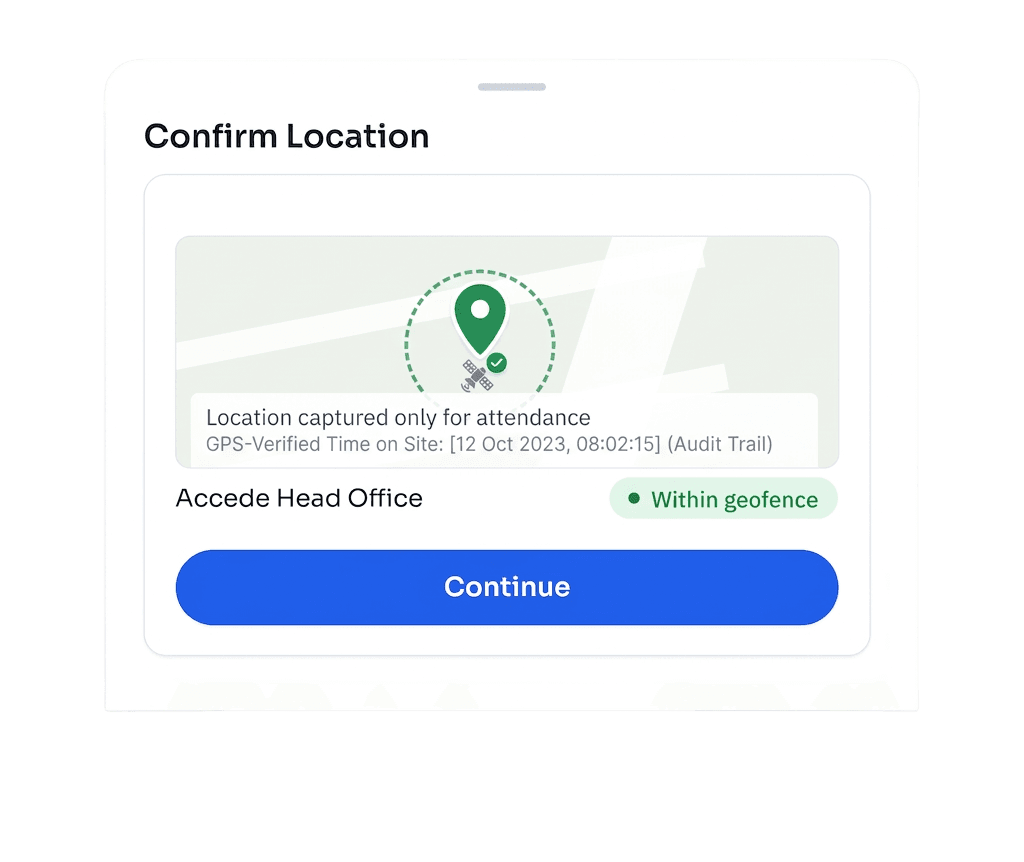
Catches padded labor hours with a timestamp, nobody has to be accused of anything.
Hard stops before a job goes over, not a report that arrives after the money's already spent.
Protect the PM cadence that's actually preventing the expensive reactive work in the first place.
Competitive quotes lower job cost by changing the price, not the person doing the work.
Catches padded labor hours with a timestamp, nobody has to be accused of anything.
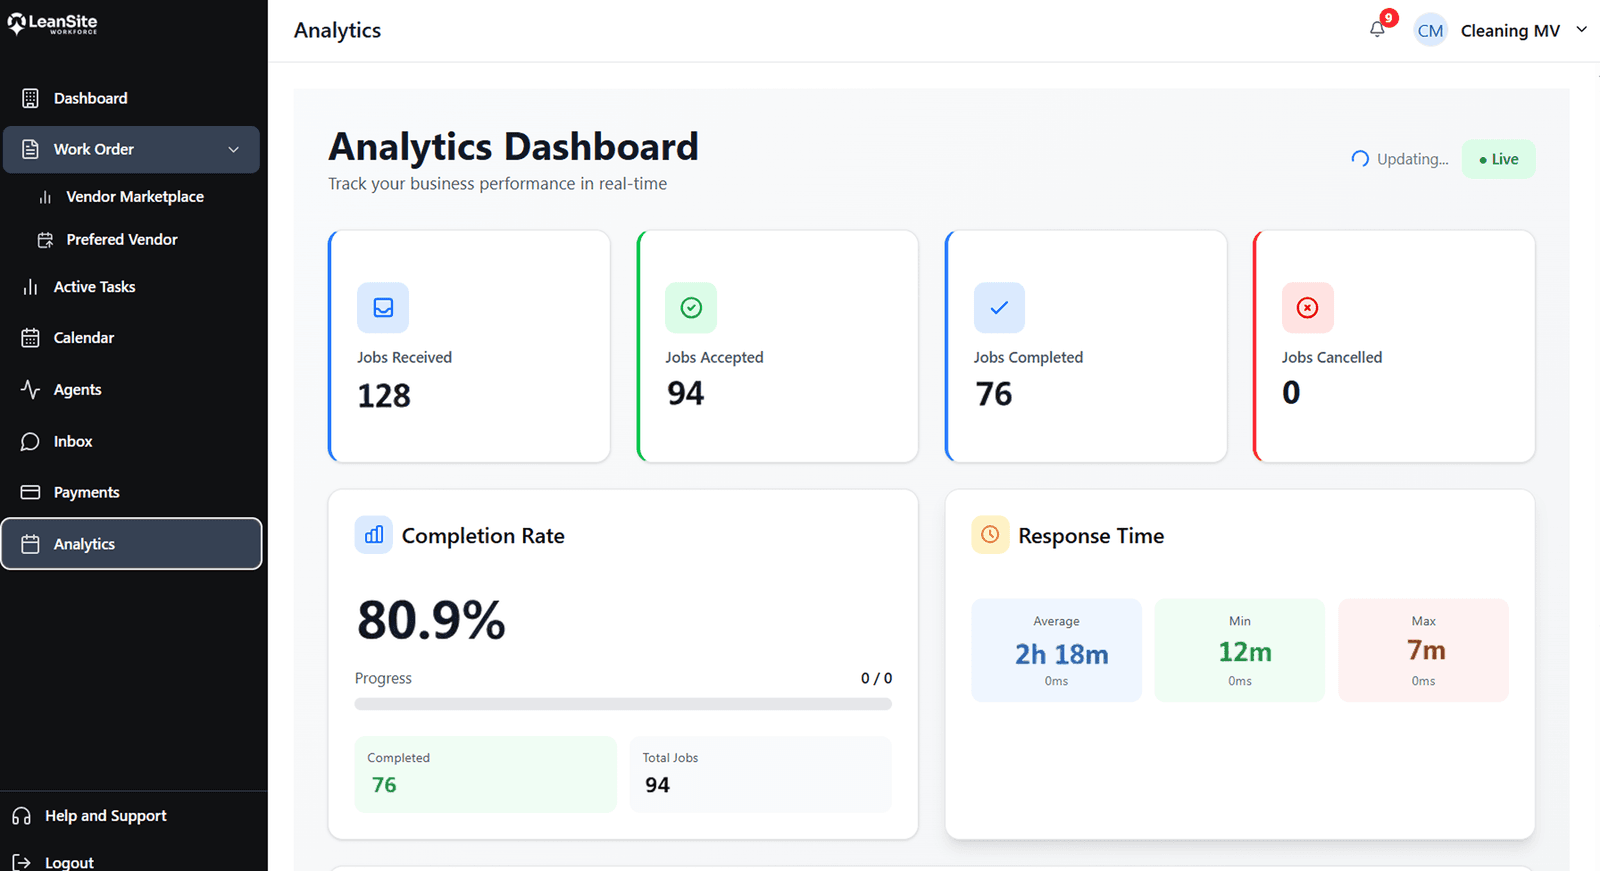
Completion rate, time on site, and labor cost, so "we're over budget" becomes a real, specific number.
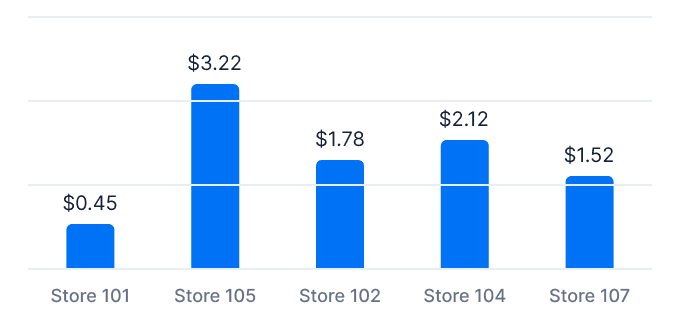
Find the one property running hotter than every other site before it's just "how that store operates."
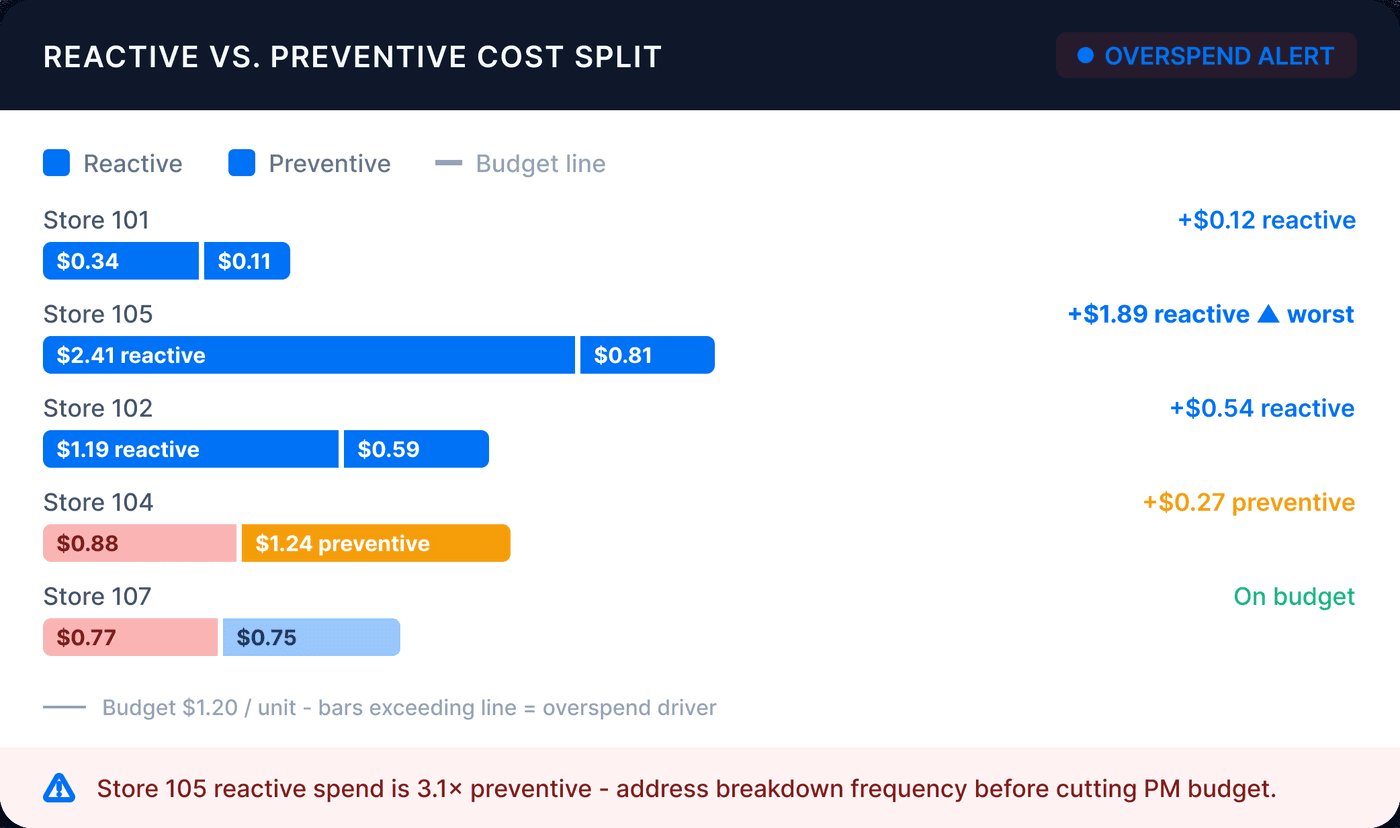
See exactly which side of the ledger is actually driving the overspend before you cut anything.
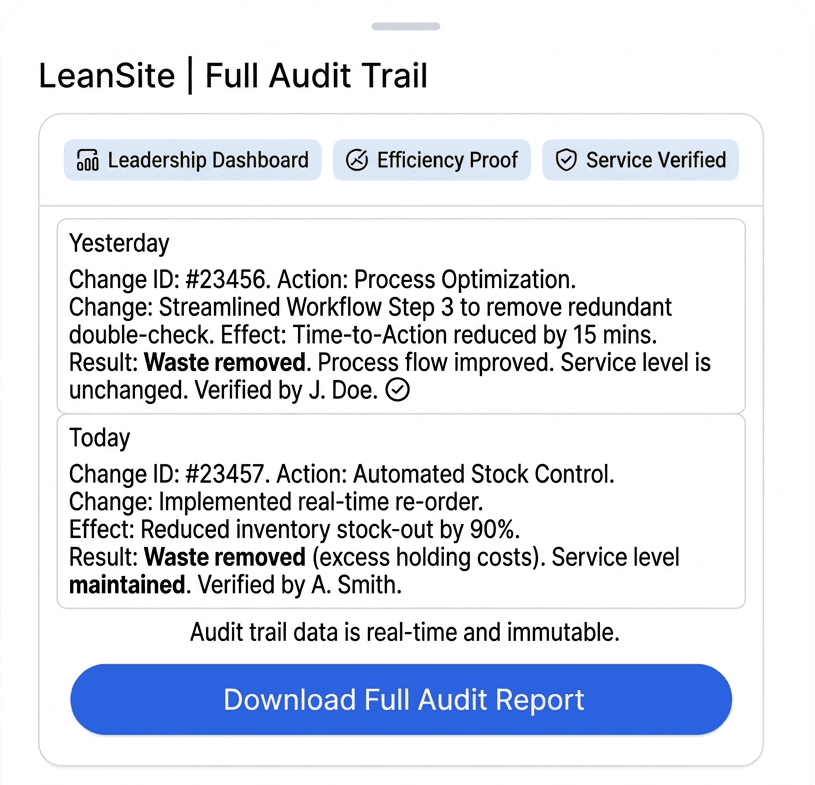
Show leadership exactly what changed, proof that waste was removed, not that service was reduced.
Completion rate, time on site, and labor cost, so "we're over budget" becomes a real, specific number.
Find the one property running hotter than every other site before it's just "how that store operates."
See exactly which side of the ledger is actually driving the overspend before you cut anything.
Show leadership exactly what changed, proof that waste was removed, not that service was reduced.
How teams actually use it

A portfolio over budget on paper turns out to be one category of unplanned repairs driving the whole number.

Cut cost at the properties with real slack, not by trimming the preventive schedule everywhere at once.

A second quote on the marketplace brings the price down without anyone having an awkward conversation.

GPS-verified time on site makes the correction data-driven, not personal.

Benchmarking surfaces the outlier before it's just accepted as normal for that site.

Completion rate and response time in the same report as the cost savings, the receipts are built in.
We were spending thousands each month juggling multiple vendors. With Leansite's centralized dashboard, we now track, manage, and approve work orders in one place. The cost savings and efficiency gains have been incredible.
Bring your own spend data. We'll show you where the reactive cost is coming from.