

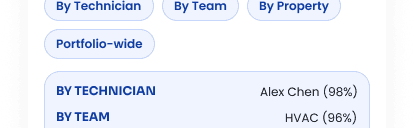
Completion Rate
See the percentage of work orders closed out properly — by technician, by team, by property, or portfolio-wide.
Completion rate, average time on site, photo compliance, and labor cost, measured automatically, across every technician and every property. Stop wondering who's actually fast and who's cutting corners.
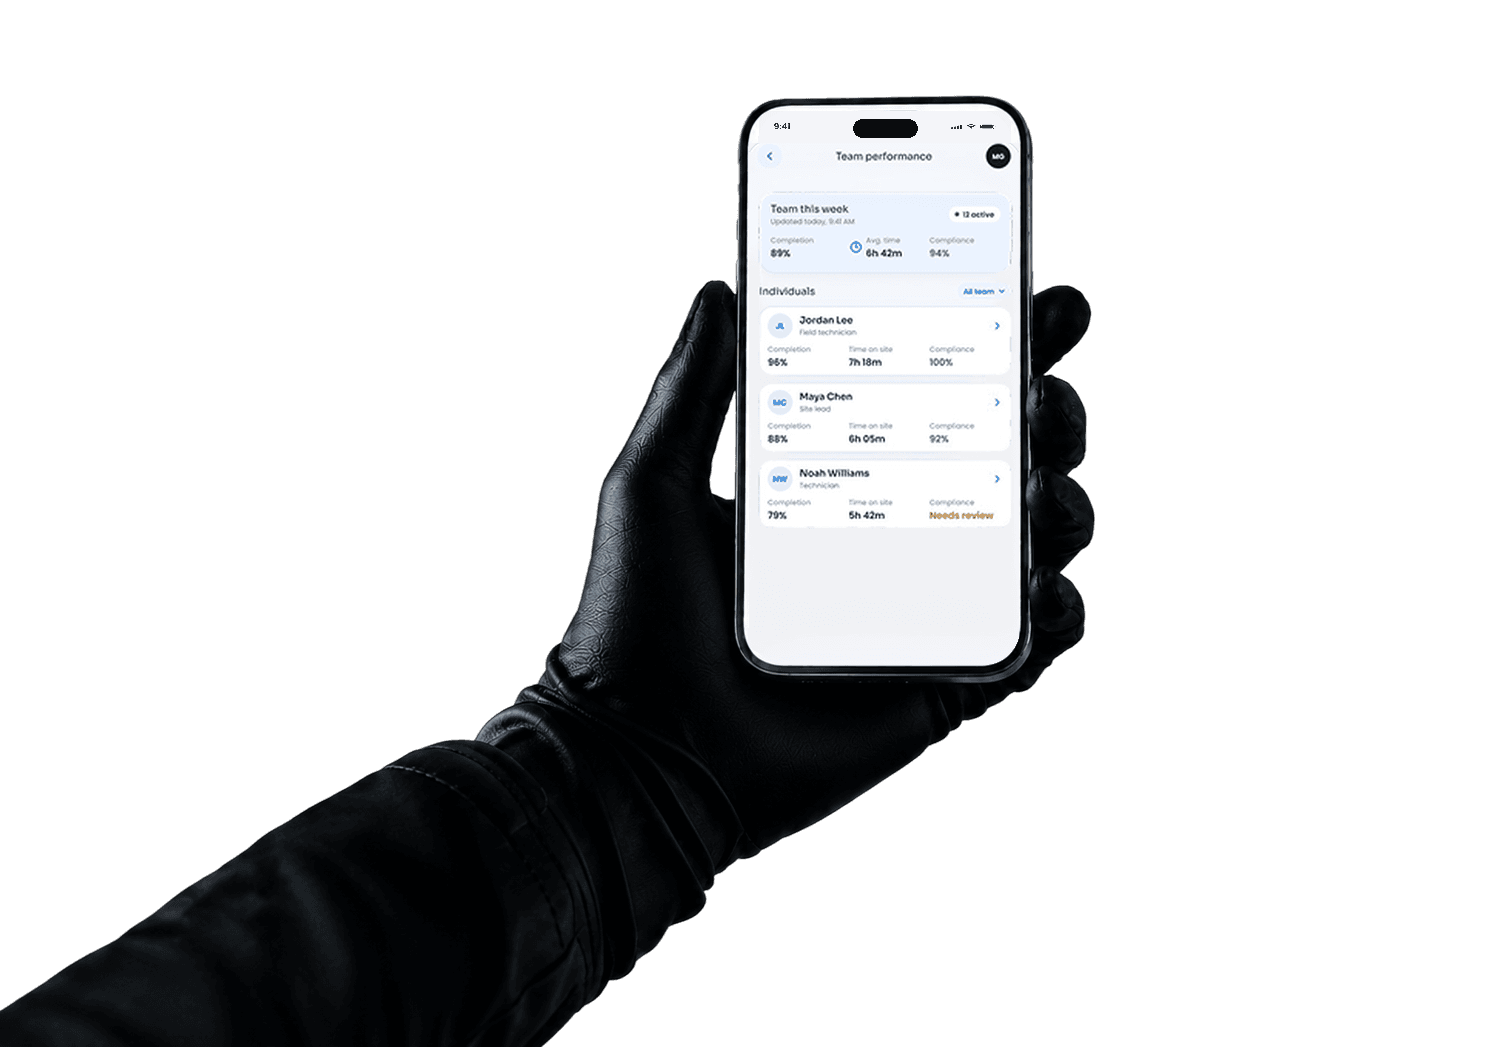





Not an estimate pieced together at month end, measured continuously, from the same data every job already generates.
See the percentage of work orders closed out properly — by technician, by team, by property, or portfolio-wide.

Know how long jobs actually take, measured from GPS-verified check-in to check-out, not a self-reported guess.
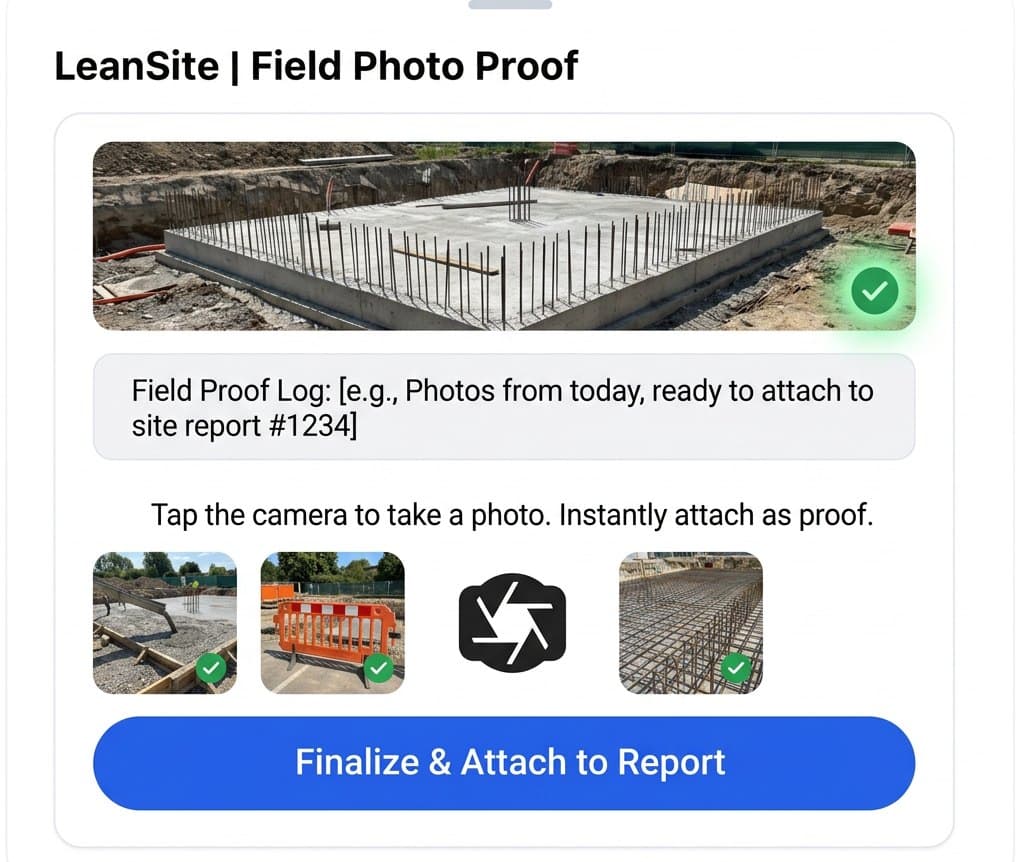
Track how consistently technicians are documenting work with photos, catch the pattern before it becomes a habit.
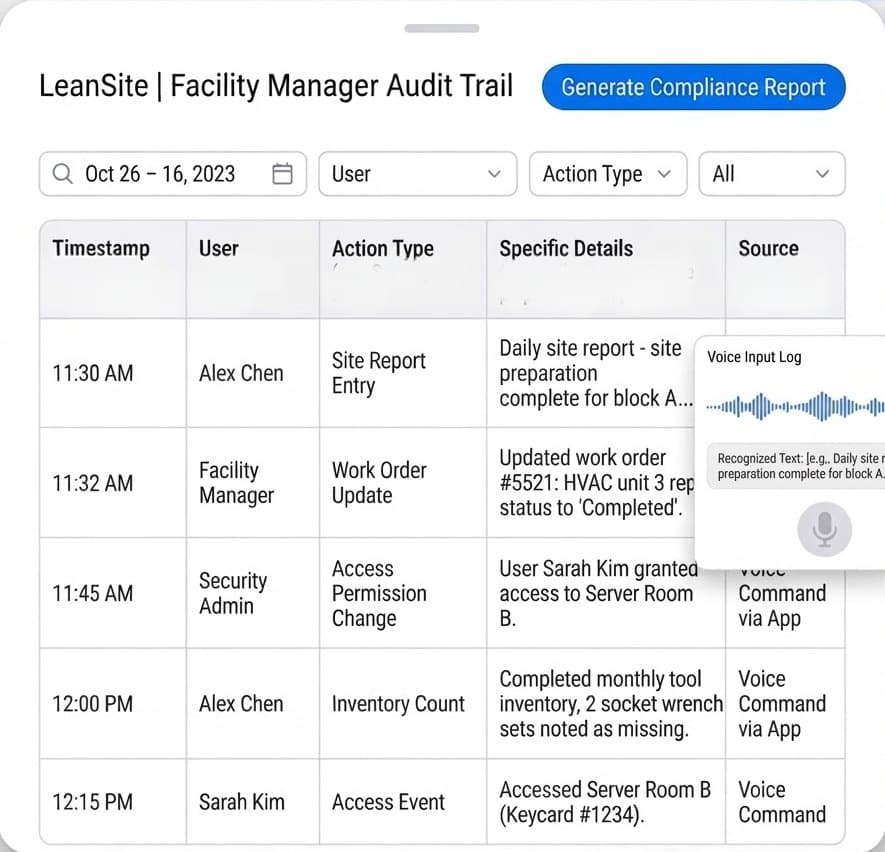
Every number traces back to a real, timestamped event, nothing on the dashboard is a rough estimate.
See the percentage of work orders closed out properly — by technician, by team, by property, or portfolio-wide.
Know how long jobs actually take, measured from GPS-verified check-in to check-out, not a self-reported guess.
Track how consistently technicians are documenting work with photos, catch the pattern before it becomes a habit.
Every number traces back to a real, timestamped event, nothing on the dashboard is a rough estimate.
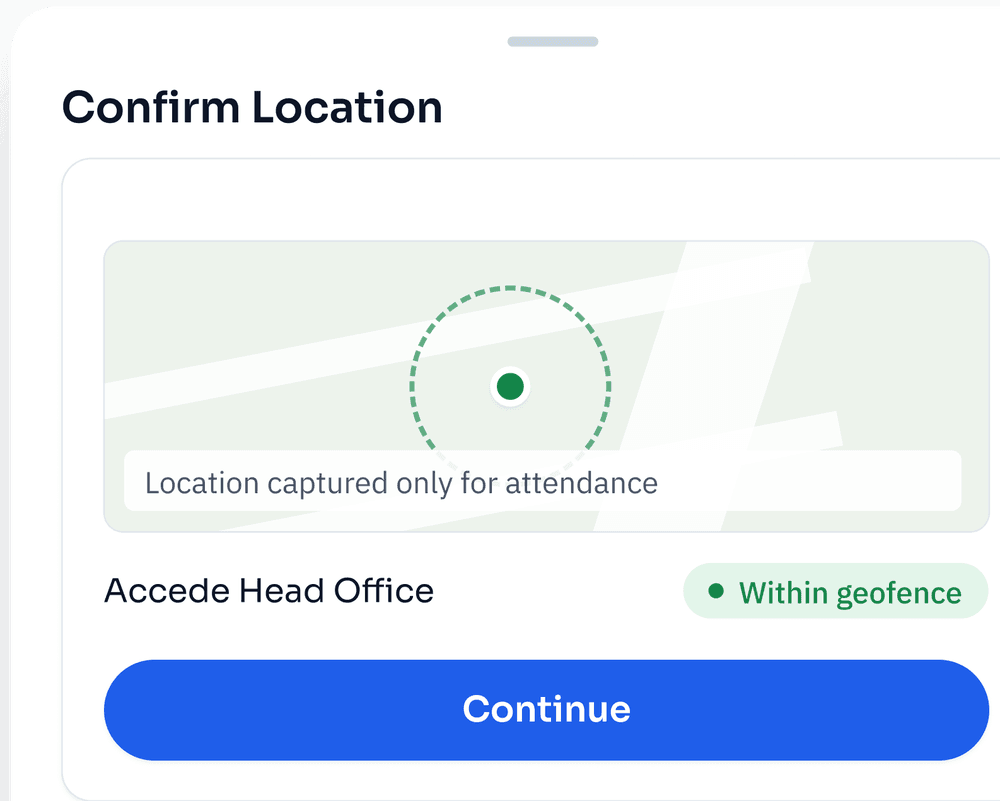
Every metric above is built on real check-in, pause, resume, and check-out events, not typed-in timesheets.
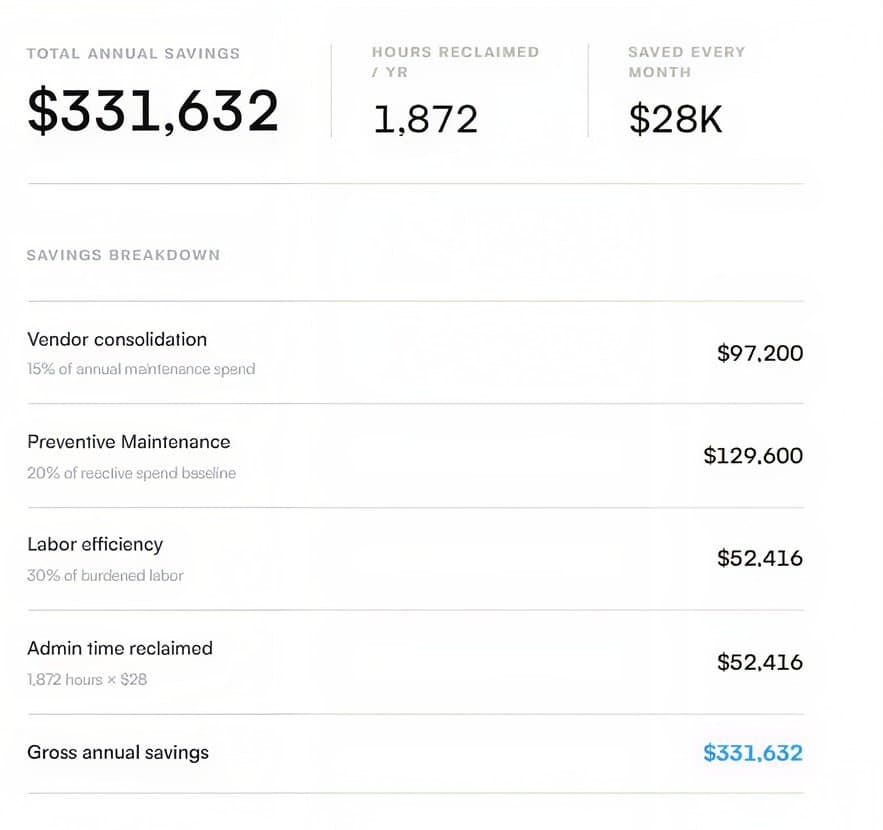
Real labor cost, rolled up by technician, team, property, or the whole portfolio, not a spreadsheet estimate.
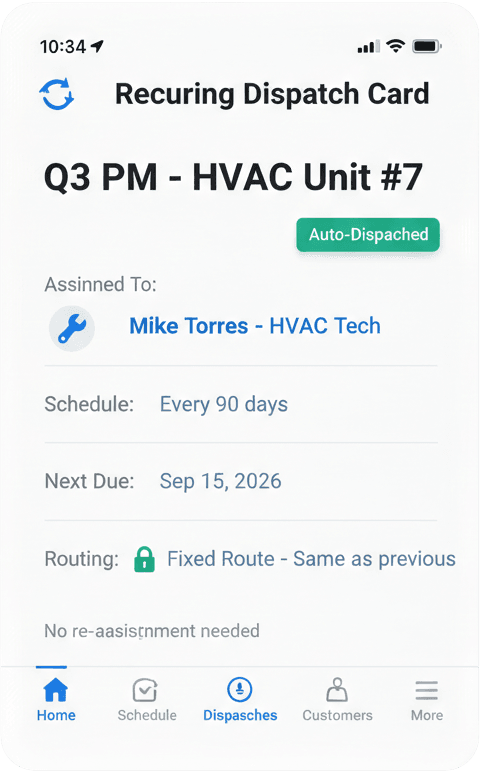
Drill into any individual's numbers, completion rate, average time, compliance, not just the team average.
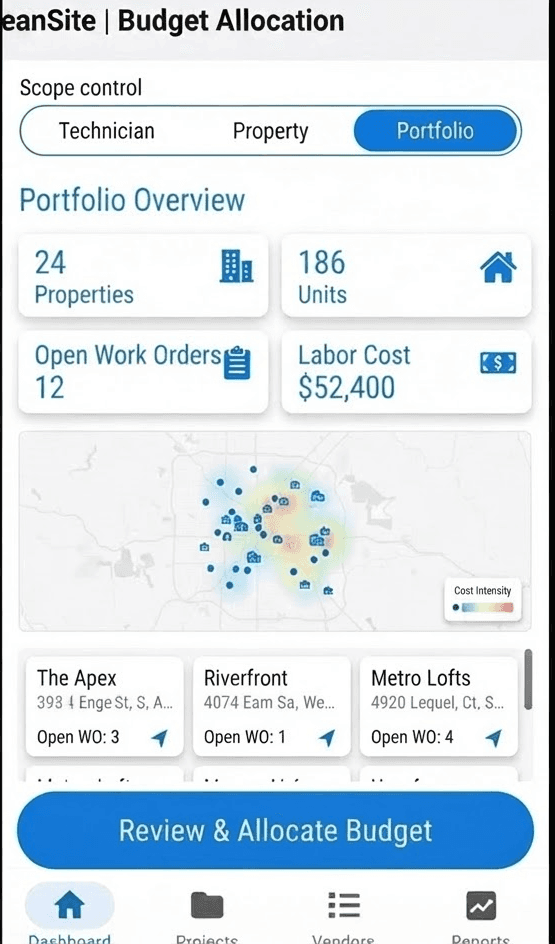
Zoom out from one technician to one property to the entire portfolio, in the same dashboard.
Every metric above is built on real check-in, pause, resume, and check-out events, not typed-in timesheets.
Real labor cost, rolled up by technician, team, property, or the whole portfolio, not a spreadsheet estimate.
Drill into any individual's numbers, completion rate, average time, compliance, not just the team average.
Zoom out from one technician to one property to the entire portfolio, in the same dashboard.
Four metrics, drilled into one at a time, this is the real walkthrough, not a highlight reel.
Step 1 of 5
Dashboard opens
Four metrics, one view.
Real metrics, built from real events, not a rough estimate at month-end.
Where the numbers actually come from
Two worth a closer look

Not a rough monthly estimate, real labor cost rolled up from actual, GPS-verified time on site. Break it down by technician, by property, or see the whole portfolio at once.

A single number that shows whether documentation is actually happening, before a dispute comes up with no photo evidence to back you.

The team number is a starting point, not the whole picture. Click into any individual to see their completion rate, time on site, and compliance on their own.
How teams actually use it

A completion rate 16 points below the team average is a conversation to have this week, not something discovered at review time.

Same job type, 45 minutes longer than every other site, that's worth a real look, not a shrug.

Photo compliance dropping from 96% to 88% shows up on the dashboard before it shows up as a dispute with no evidence.

Built from actual time on site, not a monthly estimate somebody eyeballed the night before a budget meeting.

Same four metrics, every team, every site, a real comparison instead of a hunch about who's doing better.

Completion rate, time on site, compliance, and cost, current, accurate, and ready before anyone asks for them.
We were spending thousands each month juggling multiple vendors. With Leansite's centralized dashboard, we now track, manage, and approve work orders in one place. The cost savings and efficiency gains have been incredible.
The numbers that never quite added up. We'll show you exactly where they come from, live, on your own data.