TL;DR
A facility management cost savings calculator should compare current spend against expected savings from labor efficiency, fewer reactive repairs, vendor control, and software costs. The strongest ROI cases use real work order data, conservative savings assumptions, and a payback view that finance leaders can verify.
A facility management cost savings calculator turns messy maintenance activity into a finance-ready estimate of dollars saved, payback period, and operating impact. For facility teams comparing spreadsheets, CMMS tools, vendor portals, or AI-assisted platforms such as Leansite, the goal is not a flashy number. The goal is a defensible model that shows where time, repairs, downtime, and vendor spend can shrink without cutting service quality.
Facility management cost savings calculator: a planning tool that estimates avoided costs by comparing current facility operating costs with projected costs after process, staffing, technology, or vendor-management improvements.
Table of Contents
What is a facility management cost savings calculator?
A facility management cost savings calculator estimates the financial impact of improving maintenance operations across labor, assets, vendors, downtime, and software costs.
The concept follows the same logic as a cost estimate: an approximation of the cost of a project, program, or operation. Wikipedia defines a cost estimate as the product of a cost-estimating process, usually expressed as a total value and supporting details.
For facilities, the calculator should not treat "savings" as one bucket. A strong model separates hard savings, soft savings, avoided costs, and timing. That split matters because finance teams usually trust a reduced invoice more than a productivity assumption.
Key insight: The best calculator does not promise savings. It shows the assumptions behind savings, then lets the operations team test conservative, expected, and aggressive scenarios.
Calculator outputs worth showing finance
A practical facilities ROI model should return a few numbers that leaders can act on:
- Annual savings: estimated dollar reduction across labor, repairs, vendors, and downtime.
- Net savings: annual savings minus software, implementation, and training costs.
- Payback period: months required for savings to cover investment.
- Savings per location: useful for multi-site teams comparing regional performance.
- Cost per work order: total maintenance cost divided by completed work orders.
These outputs also support better planning for teams running multiple buildings, campuses, or retail sites. For deeper operating context, multi-site teams can pair this model with a guide to multi-location facilities management software.
Which inputs matter most for FM savings?
The most important inputs are current maintenance spend, work order volume, labor time, vendor costs, asset failure patterns, and the cost of the proposed improvement.
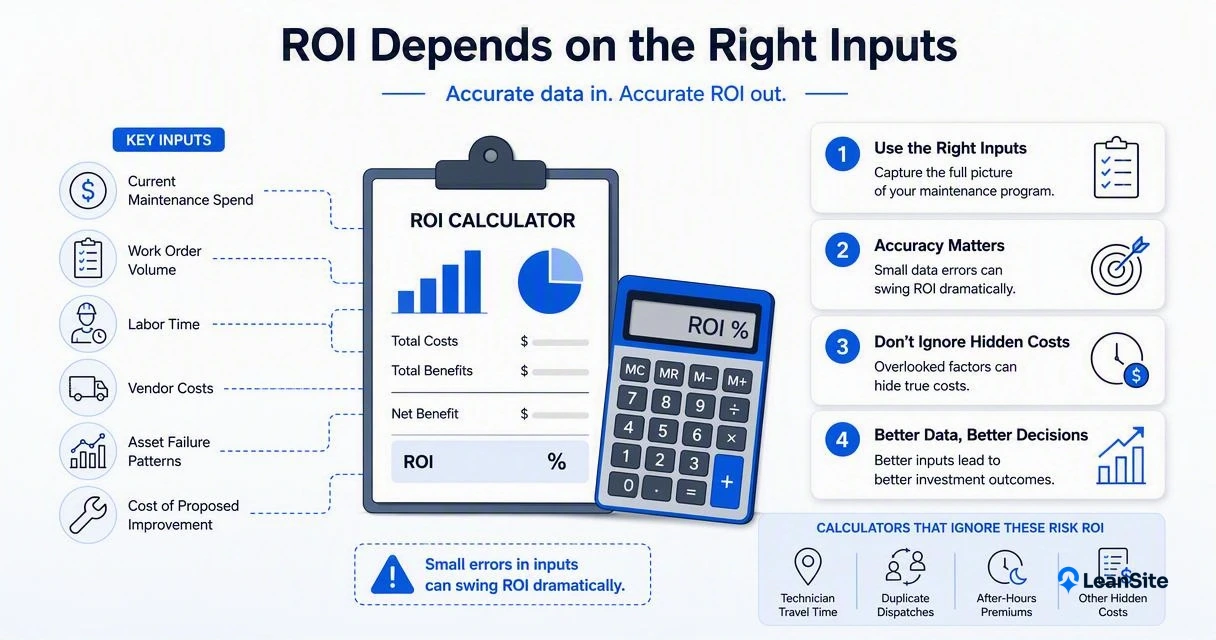
Small errors in these inputs can swing ROI dramatically. A calculator that ignores technician travel time, duplicate dispatches, after-hours premiums, or invoice disputes will usually undercount true cost. A calculator that assumes every process improvement becomes cash savings will usually overstate value.
Core calculator input table
| Input | Why it matters | Example source |
|---|---|---|
| Annual maintenance spend | Sets the baseline for savings | GL codes, budget exports |
| Work orders per month | Shows task volume and workload | Ticketing system, spreadsheet |
| Average labor cost per hour | Converts saved time into dollars | Payroll or burdened labor rate |
| Average hours per work order | Measures field effort and coordination load | Technician logs |
| Vendor spend | Captures outsourced maintenance cost | AP system, vendor invoices |
| Repeat work rate | Flags poor fixes and asset issues | Work order history |
| Downtime cost | Values lost service, closed areas, or revenue disruption | Operations estimate |
| Software and rollout cost | Prevents inflated ROI | Vendor quote, internal project plan |
Poor connectivity and fragmented communication can also create hidden costs through delayed updates, duplicate visits, and missing photos. The article on poor connectivity in facilities management explains why field data quality belongs inside savings assumptions, not outside them.
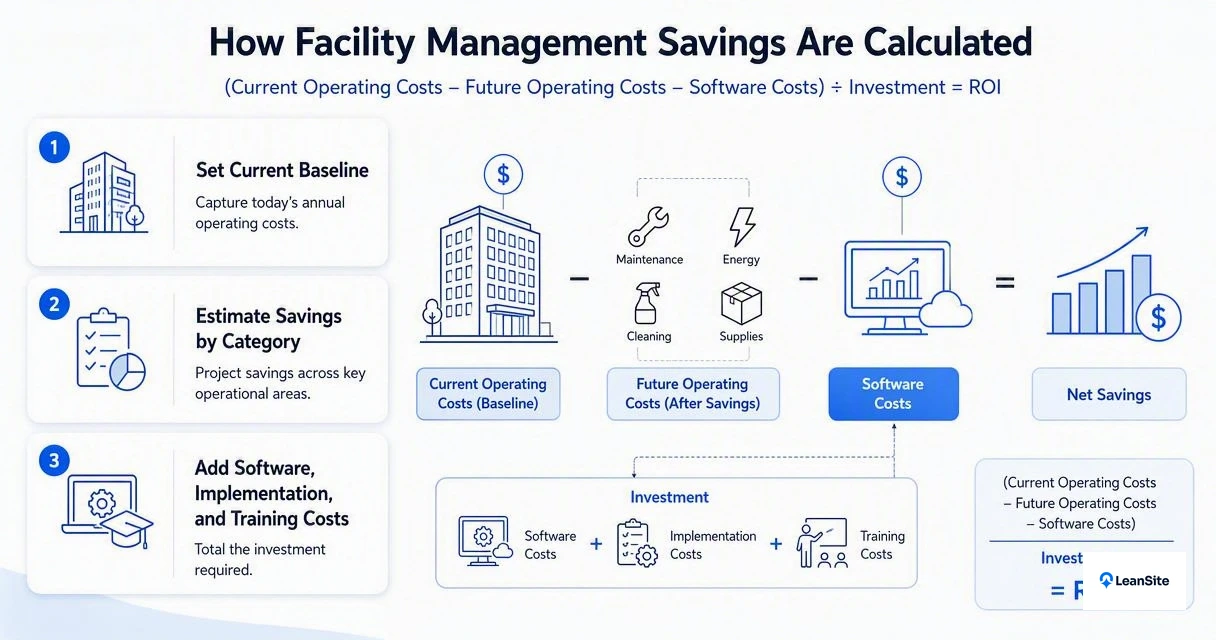
How to calculate facility management savings
Facility management savings are calculated by subtracting future operating costs and software costs from the current operating cost baseline.
- Set the annual baseline: add labor, vendor, repair, downtime, and administrative costs.
- Estimate realistic reductions: apply conservative percentages to time saved, fewer repeat visits, lower emergency work, and better vendor control.
- Subtract new costs: include software subscriptions, onboarding, integrations, and training.
- Calculate net savings: current annual cost minus future annual cost.
- Calculate payback: total investment divided by monthly net savings.
The simple formula is:
Net annual savings = Current annual FM costs - Projected annual FM costs - New program costs
A payback formula keeps the conversation grounded:
Payback period in months = Total implementation cost / Monthly net savings
"An ounce of prevention is worth a pound of cure.", Benjamin Franklin, Founders Online, National Archives
That line fits facilities because preventive maintenance savings often come from work that never becomes urgent. Still, calculators should label avoided failures carefully. A prevented chiller outage, freezer failure, or HVAC emergency is valuable, but the assumption should connect to real asset history.
Example ROI model for one portfolio
| Line item | Current annual cost | Projected change | Estimated annual impact |
|---|---|---|---|
| Internal labor coordination | $180,000 | 12% reduction | $21,600 saved |
| Vendor dispatch and follow-up | $240,000 | 8% reduction | $19,200 saved |
| Repeat repairs | $90,000 | 10% reduction | $9,000 saved |
| Emergency premiums | $75,000 | 15% reduction | $11,250 saved |
| Software and rollout | $0 | New cost | $18,000 cost |
| Net annual savings | $43,050 |
In this example, the calculator does not depend on heroic assumptions. The savings come from fewer handoffs, better triage, cleaner vendor records, and fewer avoidable emergencies.
Helpful walkthrough video for staffing assumptions
Staffing assumptions often create the biggest debate, especially when saved hours do not reduce headcount. This video gives a useful primer on translating activity volume into labor requirements:
How Leansite handles ROI tracking
The Leansite platform helps facilities teams connect ROI assumptions to live work order, vendor, asset, and location data.
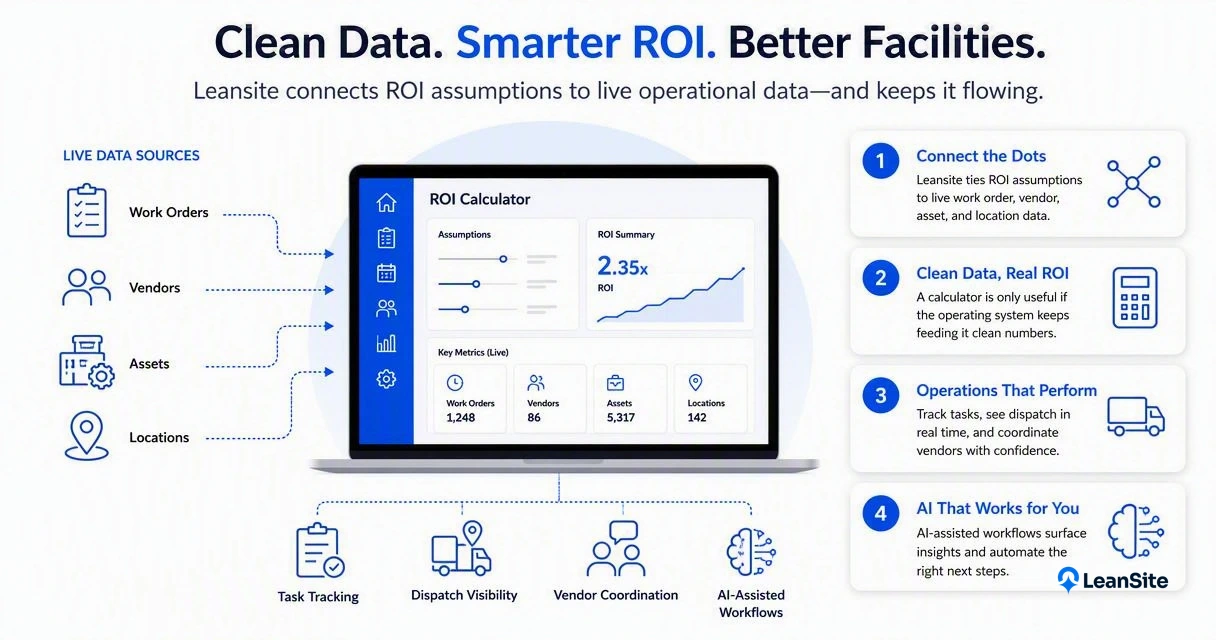
A calculator is only useful if the operating system can keep feeding it clean numbers. Leansite supports task tracking, dispatch visibility, vendor coordination, and AI-assisted workflows, which makes it easier to compare the original savings model against real performance after rollout.
Teams evaluating AI in facilities should separate automation claims from measurable outcomes. The 2023 paper by Yogesh K. Dwivedi and coauthors on generative AI notes that conversational AI creates both opportunities and challenges for research, practice, and policy, a useful reminder for facility leaders adopting AI-assisted workflows in the International Journal of Information Management.
Where calculator assumptions become trackable metrics
| Savings assumption | Operational metric to monitor | How software helps |
|---|---|---|
| Less admin time | Time from request to dispatch | Centralized ticket routing |
| Fewer vendor follow-ups | Jobs with complete status updates | Vendor portals and mobile updates |
| Lower repeat work | Reopened tickets by asset | Asset and repair history |
| Faster approvals | Approval cycle time | Rules, alerts, and documentation |
| Better portfolio control | Spend by site and trade | Multi-location reporting |
For teams comparing AI-enabled workflows, the guide to AI facility management software offers useful criteria. Leansite also includes Vera, an AI assistant designed for facility workflows, and the background on Vera inside Leansite AI explains where AI can support routing, answers, and follow-up.
How should teams use the calculator in 2026?
In 2026, facility teams should use savings calculators as living budget tools, not one-time sales worksheets.
Work order data, vendor rates, service-level targets, insurance expectations, and labor markets can change during the year. A useful model gets refreshed quarterly, then compared against actual savings. Restaurant chains, retail operators, property portfolios, and campuses all benefit from this rolling view because cost pressure rarely arrives evenly across locations.
A good process looks like this:
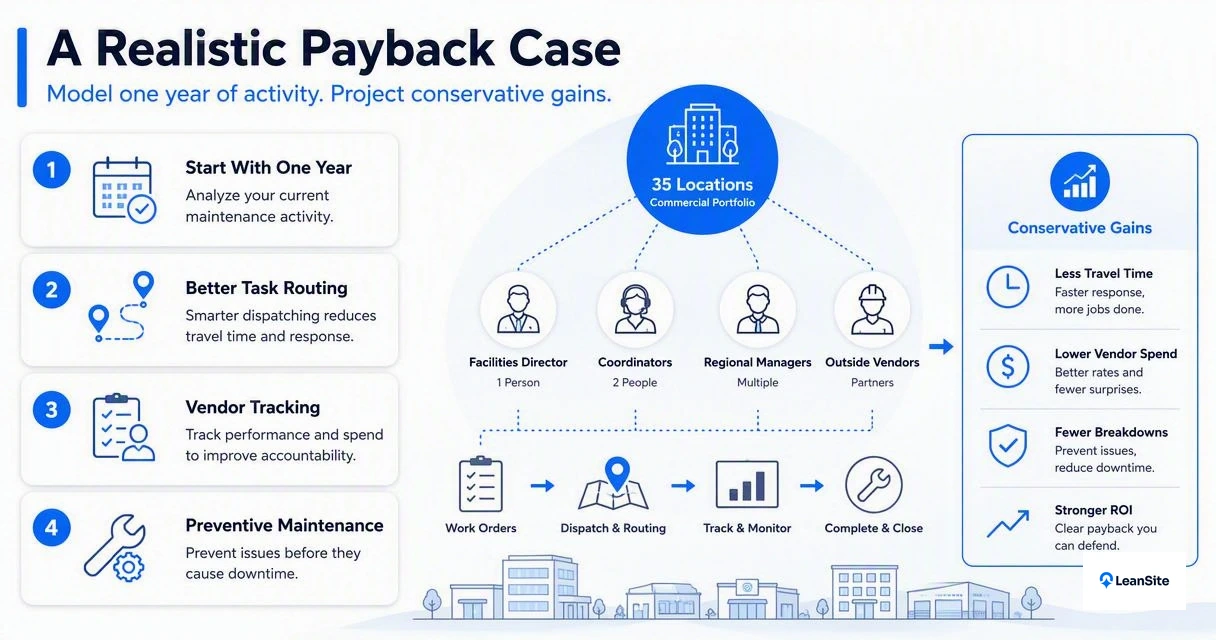
- Build the baseline from the last 12 months of spend and work orders.
- Tag costs by location, asset, trade, and vendor.
- Create three ROI cases: conservative, expected, and aggressive.
- Review assumptions with finance and operations.
- Track actuals monthly after rollout.
- Update the calculator every quarter.
For food-service portfolios, maintenance savings often depend on uptime, refrigeration, HVAC, and emergency response. The 2026 guide to facilities management for restaurant chains is a useful companion when location revenue risk affects the ROI model.
Teams that need cleaner ticket history before modeling savings may also review the guide to the best facilities ticket management system for 2026. Better ticket data creates better calculator inputs.
Frequently asked questions
What costs should be included in a facilities ROI calculation?
A facilities ROI calculation should include internal labor, outsourced vendor spend, parts, emergency premiums, downtime, administrative coordination, software fees, onboarding, and training. The strongest models separate hard invoice savings from productivity gains so finance teams can review each assumption clearly.
What is a good payback period for facility management software?
A good payback period depends on portfolio size, current inefficiency, and implementation cost. Many teams prefer a payback view in months because it is easier to compare with budget cycles. A conservative model should still show value without assuming perfect adoption.
Can avoided downtime be counted as savings?
Avoided downtime can be counted when the estimate ties to a credible operating impact, such as closed rooms, lost production time, missed sales, or service interruptions. The number should be shown separately from hard cost reductions because it is often an avoided cost, not a direct budget cut.
How often should calculator assumptions be updated?
Calculator assumptions should be updated at least quarterly. Vendor rates, asset performance, labor costs, and work order volumes can shift quickly. Quarterly updates keep savings projections aligned with actual operating data and make annual budget planning less reactive.
Conclusion
A facility management cost savings calculator works best when it turns daily maintenance activity into a clear business case: current cost, projected savings, new investment, net savings, and payback. The next step is simple: gather the last 12 months of work orders, vendor invoices, and labor assumptions, then build a conservative model before selecting software or changing process.
For teams ready to connect calculator assumptions with real facilities data, Leansite offers a practical path from work order tracking to vendor coordination and portfolio visibility. Visit getleansite.com to review how the platform supports measurable facility operations savings.