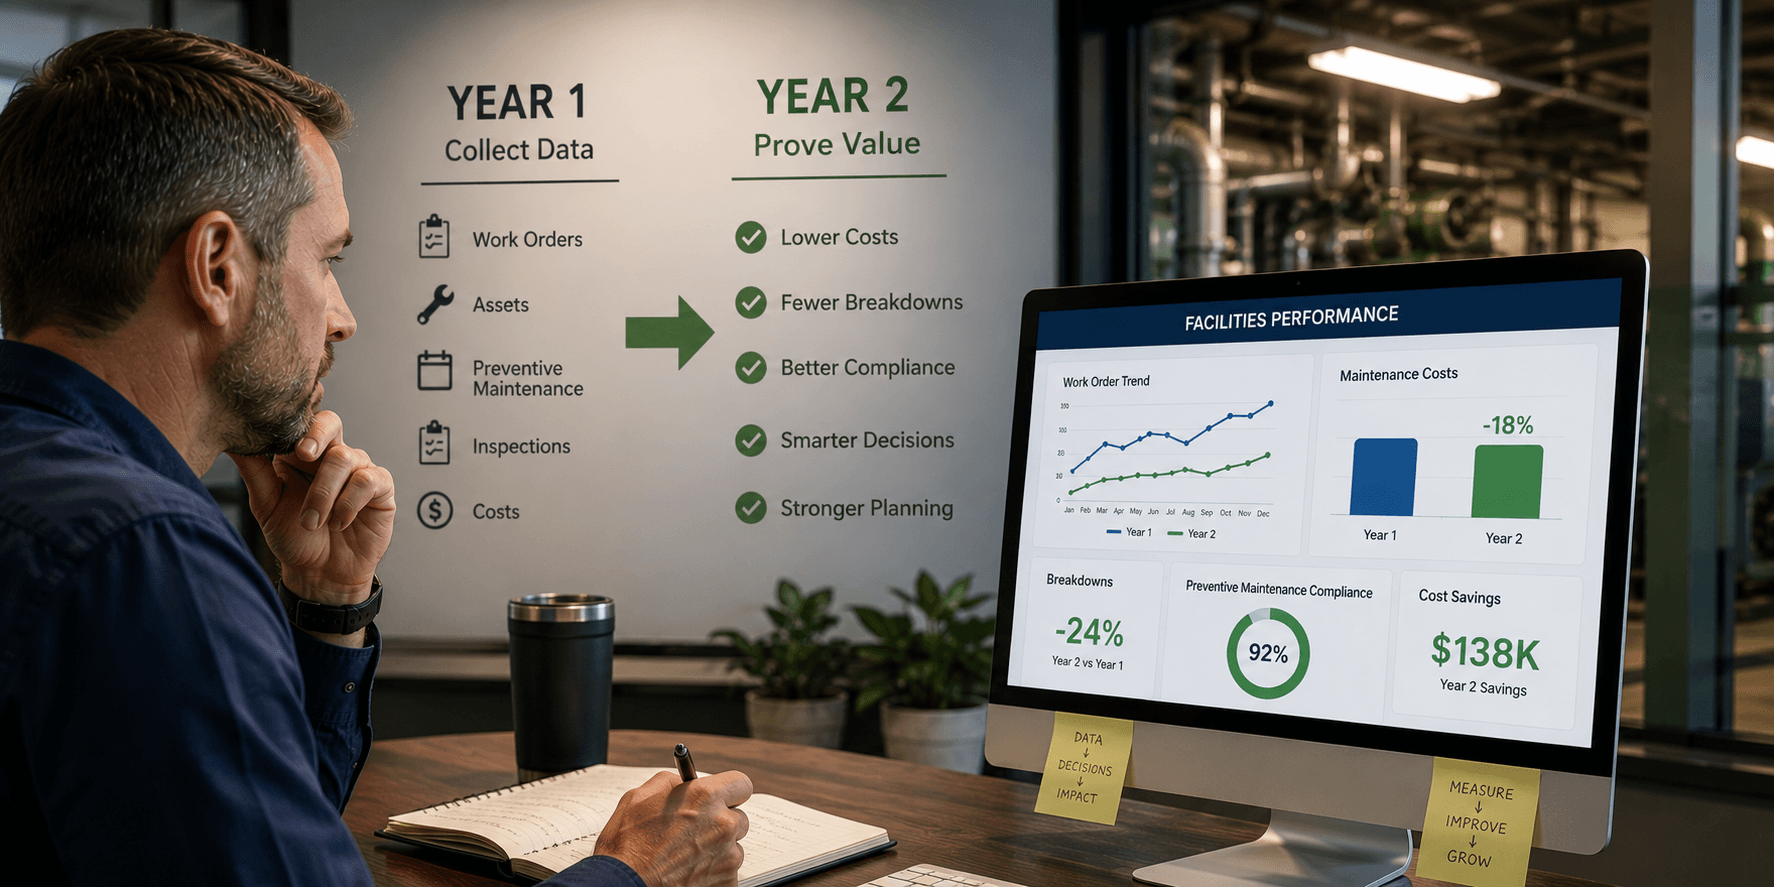
Every facilities team that adopts new maintenance software hears some version of the same question in month three: "Is this actually working?" It's the wrong question to ask that early. Maintenance history software, also known as a computerized maintenance management system (CMMS), doesn't prove its value on day one. It proves it in the second year, once there's enough repair history, cost data, and vendor performance to compare against.
Quick answer: The first year is mostly about collecting clean, structured data. The second year is when that data starts answering questions leadership actually cares about, repair-versus-replace decisions backed by cost history, vendor performance benchmarks, capital planning with real numbers, and portfolio-wide comparisons that surface outliers. Whether a system can deliver that in year two depends entirely on how well it structured the data in year one.
Why Is the First Year About Collection, Not Proof?
In year one, every ticket, repair cost, and vendor callback logged into a system is a data point without context yet. There's no prior year to compare against, no baseline to show whether HVAC repair costs are trending up or down, and no way to tell if a vendor's response time is actually improving. This is normal, and it's the reason facilities leaders shouldn't judge asset tracking software on first-quarter results. The real work of year one is making sure the data being collected is complete and consistent enough to be useful later.
This is also where the structure of the software you choose matters from day one. A system that assigns every asset a unique ID, a status, and a criticality rating the moment it's added, rather than treating assets as an afterthought to ticketing, is what makes year-two comparisons possible at all.
What Turns Collected Data Into Proof?
By year two, the same system that felt like busywork starts answering questions leadership actually cares about:
Repair-vs-replace decisions backed by cost history. Once an asset has a full year of repair costs attached to it, comparing that total against replacement cost turns a guess into a defensible recommendation. This works best when purchase cost, purchase date, warranty expiration, expected lifespan, and replacement cost are tracked automatically on the asset record, alongside its full work order history, rather than something a facilities manager has to reconstruct manually.
Vendor performance benchmarks. Response time, first-time fix rate, and repeat visit frequency only mean something once there's a full cycle to compare. A vendor who looked fine in month two might reveal a pattern of slow response by month fourteen. Tracking work orders completed, total amount spent, and last service date per vendor on the asset record itself is what lets that pattern surface without pulling data from separate spreadsheets. See Vendor Dispatch and Predictive Maintenance Automation for Multi-Site Teams for more on this layer.
Capital planning with real numbers. Finance teams don't approve budget requests based on intuition. A facilities team walking into a budget meeting with two years of cost-per-asset trends gets funding approved faster than one presenting last year's number plus a percentage guess. That case is backed by real, external data too. The U.S. Department of Energy's Federal Energy Management Program estimates that a functional preventive maintenance program saves roughly 12% to 18%, on average, compared to a reactive-only approach, a number worth citing directly in that budget conversation rather than relying on internal estimates alone.
Portfolio-wide comparisons. Once every property or site has a comparable data set, outliers become visible. A location with HVAC costs running well above similar sites signals either equipment nearing failure or a maintenance process gap. Role-based, permission-based access that lets an operations manager compare asset performance across an entire portfolio without exporting data property by property is what makes this practical at scale.
A documented case for the facilities team itself. This is the part that often gets missed. Two years of data doesn't just justify software spend, it becomes the evidence a facilities director uses to justify headcount, budget, and authority within the organization. An immutable audit trail logging every change to an asset (user, timestamp, field changed, old value, new value) doubles as compliance-ready documentation when that case needs to hold up to scrutiny.
Why Does the Underlying System Matter More Than the First Report?
None of this works if the platform collecting the data in year one isn't built to make it usable in year two. A system that logs tickets but doesn't tie them to a specific asset, doesn't standardize categories across properties, or doesn't retain vendor performance history over time will leave a facilities team with a pile of records instead of a pattern.
A few structural things matter for this specifically:
-
Asset-based work orders. Tying a work order to a specific asset, rather than just a property, means the completed job flows straight into that asset's maintenance history without anyone re-tagging or reconciling it later.
-
Bulk asset import. Portfolios with existing spreadsheets of equipment shouldn't have to start from zero. Bulk upload with validation lets teams with 100 or more assets get structured data into a system in hours rather than weeks.
-
Smart search and filtering. Assets filterable by type, status, criticality, or location are what makes portfolio-wide outlier analysis practical rather than theoretical.
How Do the Leading Platforms Compare on This?
MaintainX, UpKeep, and Limble are strong at logging and scheduling day-to-day work, and all three are well-reviewed, capable tools. Where they tend to show less depth is in structured, asset-level history that compounds into portfolio insight over time, since that wasn't the primary problem any of them were originally built to solve. ServiceChannel and Corrigo offer strong vendor and multi-site reporting at enterprise scale, genuinely useful for large, vendor-heavy portfolios, but often at a cost and complexity that outpaces what a mid-sized facilities team needs simply to start building a two-year case with its own data.
Where LeanSite AI Fits
LeanSite AI, the platform this article's publisher builds, is designed around exactly this structure, according to its own published feature set. Every asset gets an auto-generated ID, status, and criticality rating from the moment it's added, with lifecycle and financial data, a Work Orders tab, and a Vendors tab attached automatically. Asset-based work orders, bulk CSV import, smart filtering, role-based multi-location access, and a full audit trail are all built around the same goal: making sure the data structured in year one is actually usable in year two. As with any vendor's description of its own product, this is worth confirming directly in a trial or demo.
FAQ: Proving the Value of Facilities Data
How long does it take for maintenance software to show ROI? Most facilities teams see the real value emerge in year two, once there's enough historical data to compare trends rather than just log activity.
What data matters most for proving facilities team value? Asset-level repair costs, vendor performance history, and portfolio-wide comparisons are the three data points that most directly support capital planning and budget conversations.
Does the software choice affect how useful year two data actually is? Significantly. A platform that doesn't structure data by asset and location from the start leaves teams reconstructing history manually, which is why the underlying system matters as much as the discipline of using it.
What features should facilities management software have to support this? At minimum: asset-level tracking with lifecycle and financial data (purchase cost, warranty, replacement cost), a maintenance history tied to each asset, vendor performance tracking per asset, multi-location reporting, and an audit trail for compliance.
Can this work across multiple properties or a large portfolio? Yes, provided the platform supports role-based, location-based permissions, so an operations manager can view asset and vendor performance across an entire portfolio while individual users only see the locations they're authorized for.
The story your facilities team tells in year two is only as good as the data structure you built in year one. Book a LeanSite AI demo to see how asset-level history turns into a case for your team's value.
Written by Pelumi Akinwande, Operations Content Lead at LeanSite, who works directly with multi-site facilities and property operations teams evaluating work order software. Connect on LinkedIn.