


Operational Health gives an Org Owner a 0-to-100 portfolio score built from four equally weighted components: Work Order Completion, Budget Adherence, Vendor Reliability and Team Efficiency. Use the score to locate the weakest component and property, then inspect the underlying operational records. The score is a diagnostic starting point; it does not establish the cause of a problem.
Before you start
Choose a reporting period that matches the decision you are making. The current screen shows 30 Days, 90 Days and Yearly. Check the live or last-updated indicator before quoting a value.
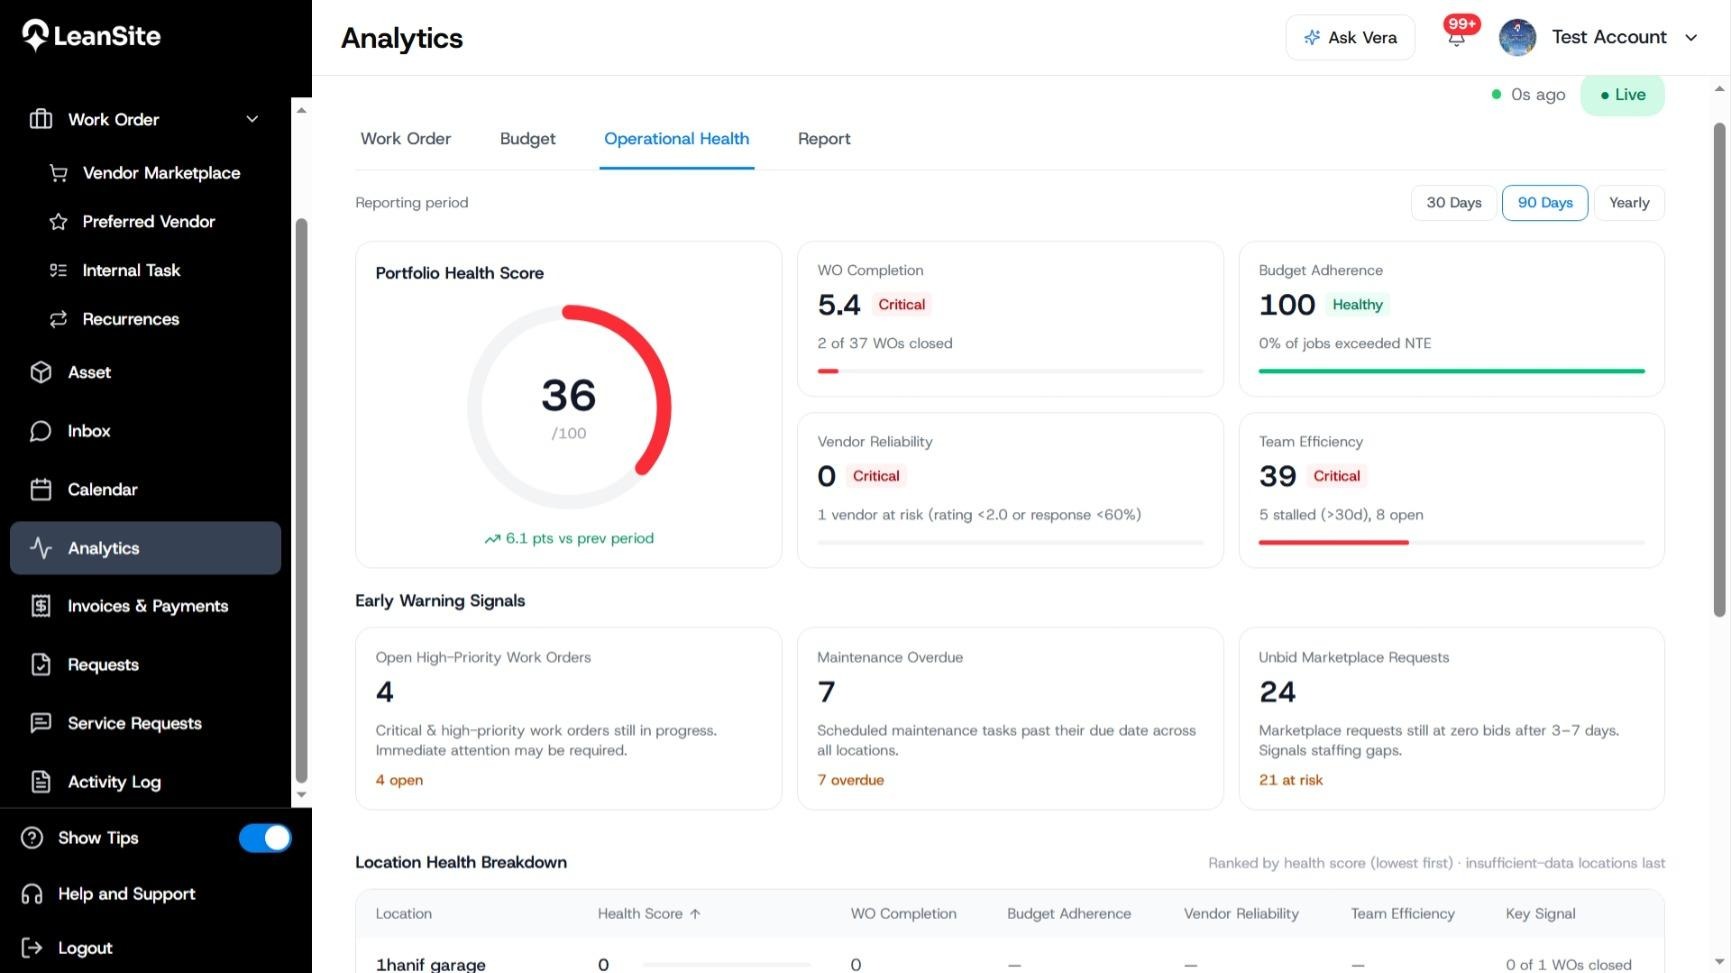
1. Read the portfolio score and band
Open Analytics and select Operational Health. Read the Portfolio Health Score, its band and the change from the previous period.
|
Portfolio score |
Band |
|---|---|
|
Above 75 |
Healthy |
|
65 to 75 |
At Risk |
|
Below 65 |
Critical |
A location is counted as healthy when its score is above 70. Keep that location threshold separate from the portfolio band.
2. Identify the component driving the result
Each component contributes 25% of the portfolio score:
|
Component |
Calculation |
Red threshold |
|---|---|---|
|
WO Completion |
Work orders closed in the last 90 days divided by work orders created in the last 90 days, multiplied by 100. |
Below 70 |
|
Budget Adherence |
100 minus the share of work orders whose invoice exceeded the NTE. |
Below 80 |
|
Vendor Reliability |
100 minus the share of at-risk vendors. A vendor is at risk when rating is below 2.0 or response rate is below 60%. |
Below 70 |
|
Team Efficiency |
100 minus a capacity-stress score that combines member overload and stale-work-order stress. |
Below 65 |
Read the driver beneath each value. It exposes the operational count behind the component, such as closed work orders, NTE exceptions, at-risk vendors, open work or items stale for more than 30 days.
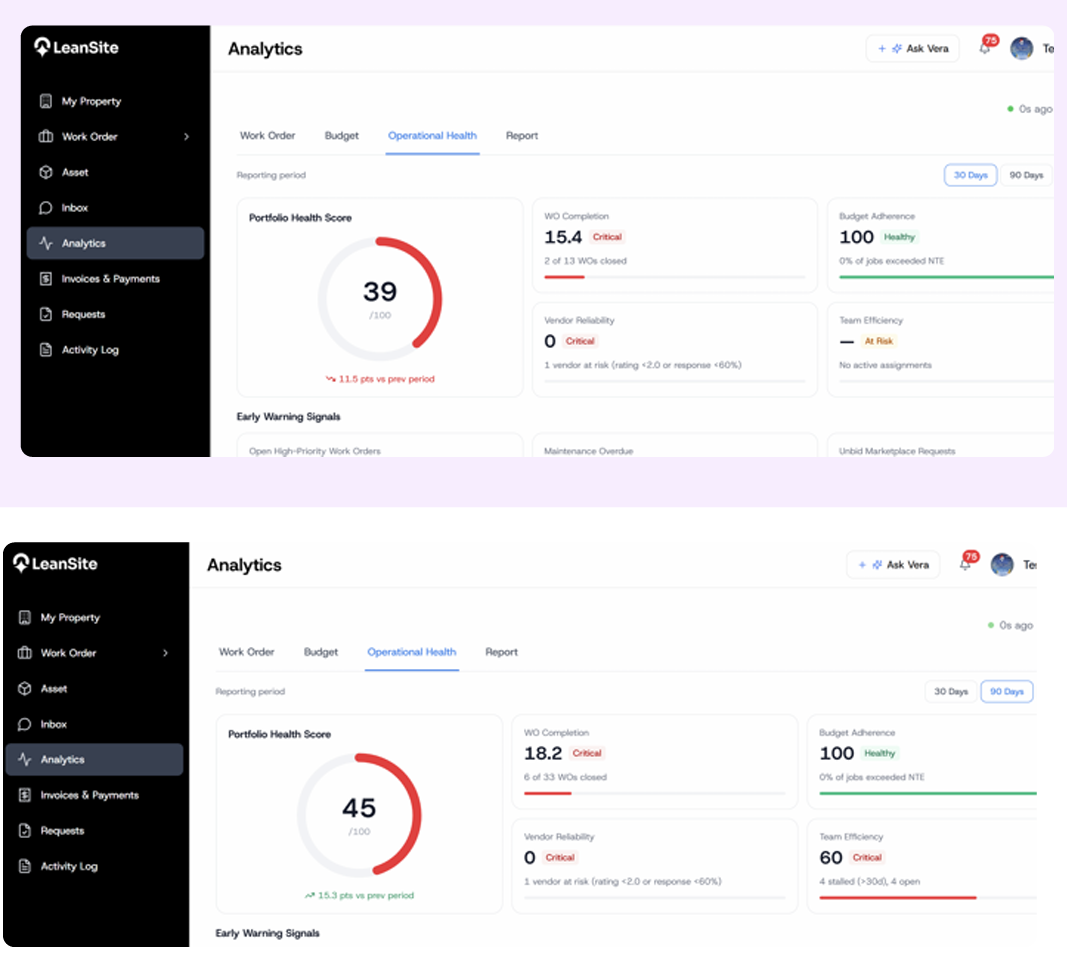
3. Change the reporting period
Select 30 Days, 90 Days or Yearly. The score and eligible component values are recomputed for the active view, while the WO Completion definition retains its documented 90-day calculation. Compare like periods and confirm which option is selected before recording a result.
The current screenshot resolves an older release-note inconsistency by showing Yearly as the third option.
4. Review early-warning signals
Scan Early Warning Signals for open high-priority work orders, overdue maintenance and unbid marketplace requests. These signals can point to emerging operational risk. They appear alongside the score and are not additional inputs to its calculation.
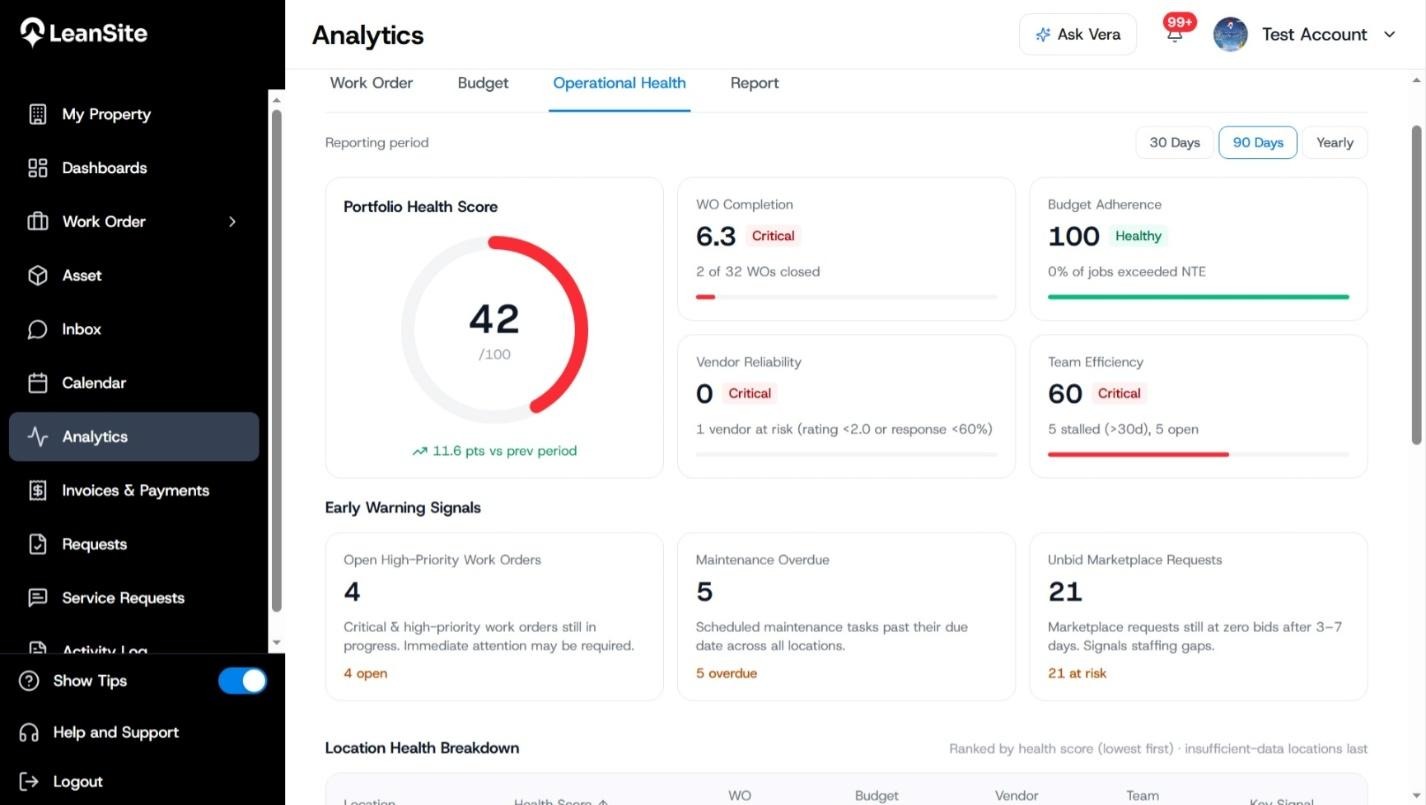
5. Find the locations requiring attention
Use Location Health Breakdown to compare each location’s score and component values. The current page ranks lower-scoring locations first and places insufficient-data locations last. Read the Key Signal column, then open the relevant Work Orders, Budget or vendor records to investigate.
Expected result
You can explain the portfolio band, name the component driving it, identify the locations that need review and connect the signal to source records before acting.
If a score is missing or surprising
Check the active period, last-updated indicator and whether enough eligible work, vendor and budget data exists. A missing-data state should not be interpreted as zero performance. Operational Health v1 has fixed 25% weights and does not support custom date ranges, custom diagnostic rules, scheduled delivery or deep metric drill-through.