TL;DR
Property owners should prioritize five dashboard views: operating costs, open work, vendor performance, asset risk, and portfolio efficiency. Compare platforms using actual maintenance records, consistent metric definitions, and clear paths from each chart to the underlying job.
A maintenance dashboard earns its place when it helps an owner decide what needs attention and where money should go. The best facilities management dashboards for property owners connect spending, service activity, and asset condition rather than simply displaying ticket counts. Leansite belongs on the shortlist for owners exploring AI-assisted facilities management. The practical starting point is choosing the decisions a dashboard must support, then evaluating software against those needs.
Table of Contents
What is a facilities management dashboard?
A facilities management dashboard is a reporting interface that brings maintenance, asset, vendor, and operating-cost information into one view. For property owners, its purpose is to show where service obligations, spending, and building performance need attention, with enough detail to support a specific operational or investment decision.
Definitions that keep reporting consistent
- Facility management: Coordinated management of buildings, workplaces, and supporting services to keep them functional, safe, and effective.
- CMMS: A computerized maintenance management system for organizing maintenance records and workflows.
- SLA: A service-level agreement defining expected service standards.
An owner dashboard should answer a business question, not merely display activity.
The five dashboard views owners should prioritize
Operating costs, open work, vendor performance, asset risk, and portfolio efficiency are the five most useful dashboard views for owner oversight. The ranking below is a practical recommendation, not a measured industry benchmark.
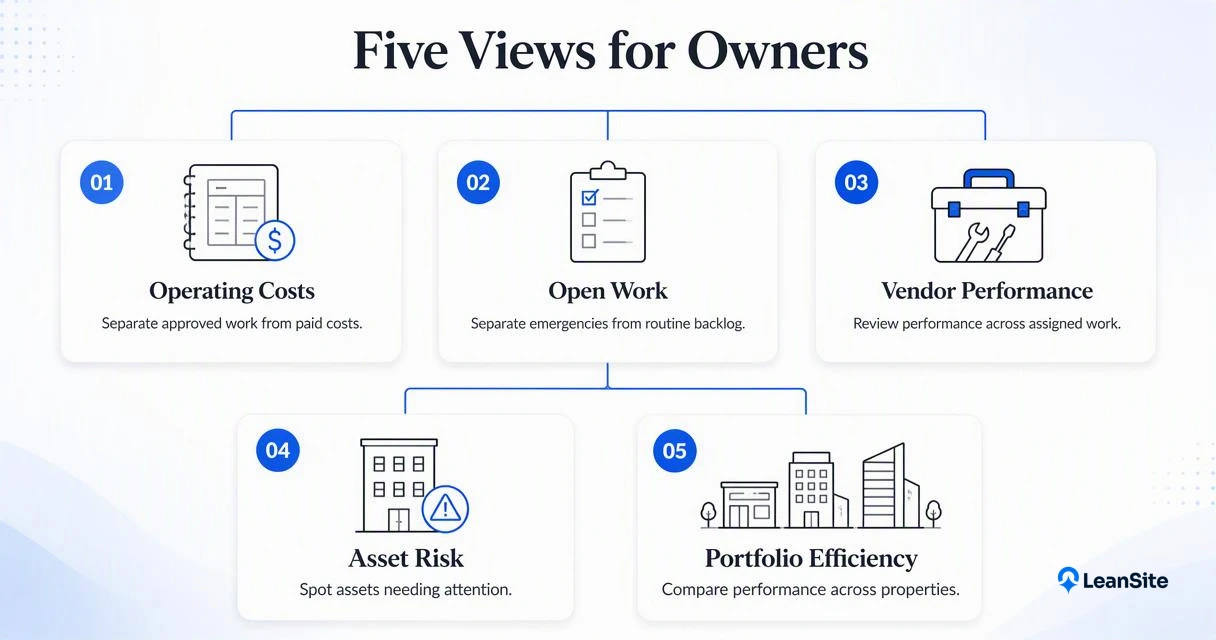
Ranked owner dashboard priorities
- Operating costs: Show actual spending against budget, committed spending, and cost by trade. Separate approved work awaiting invoices from paid expenses so owners can understand future obligations.
- Open work: Show overdue jobs, ticket age, urgency, and assigned responsibility. Separate emergency work from routine requests so a large backlog doesn't obscure an urgent equipment issue.
- Vendor performance: Compare response time, completion time, repeat visits, and invoice exceptions. Use consistent clock definitions, including whether waiting for parts pauses the service timer.
- Asset risk: Display critical equipment, recurring repairs, downtime, and preventive-maintenance completion. Prioritize assets by business impact, not age alone.
- Portfolio efficiency: Compare locations using normalized measures such as maintenance cost per square foot. Group similar property types before judging relative performance.
Sample metrics and the decisions they support
Each metric should have a defined denominator, reporting period, and decision attached.
| Dashboard | Sample metric | Owner decision |
|---|---|---|
| Costs | Actual plus committed spend versus budget | Adjust spending approvals |
| Open work | Overdue jobs by priority and age | Escalate delayed service |
| Vendors | Repeat visits for the same issue | Review repair quality |
| Assets | Repair spending by equipment ID | Assess replacement options |
| Portfolio | Maintenance spend ÷ floor area | Investigate location differences |
These are suggested measures, not universal targets. Owners evaluating facilities ticket management systems should check that job-level records support the summaries. For larger portfolios, multi-location facilities management adds context on organizing reporting across sites.
Which dashboard approach fits each owner?
Workflow-connected dashboards suit active maintenance oversight, while accounting reports and spreadsheets serve different reporting needs. The best choice depends on whether the owner primarily needs operational action, financial review, or flexible analysis.
Dashboard approaches compared
Dashboard approaches should be compared by the decisions and records they connect.
| Approach | Best fit | Evaluation focus |
|---|---|---|
| Facilities workflow dashboard | Daily maintenance oversight | Job status, responsibility, supporting records |
| Property accounting dashboard | Financial oversight | Expense categories, budgets, ledger reconciliation |
| Spreadsheet tracker | Small, clearly bounded reporting tasks | Update ownership, formulas, version control |
| Business intelligence dashboard | Cross-system portfolio analysis | Data mapping, refresh schedules, common definitions |
Who should pick which: Owners coordinating frequent repairs should prioritize workflow reporting. Finance-led teams should prioritize accounting alignment. Enterprise teams may need a business intelligence layer that combines both.
How Leansite handles this
Leansite offers an AI-assisted facilities management angle through Vera, its built-in AI assistant. The Vera overview provides a starting point for evaluating that approach.
A useful demonstration should follow one owner question from summary to supporting record: which properties need attention, which jobs explain that status, and what action follows. Owners should request demonstrations of the five priority views rather than assume every metric is preconfigured.
How should owners test a dashboard before buying?
Owners should test a facilities dashboard with representative records and real decisions before purchasing. A useful evaluation checks data accuracy, reporting scope, and the route from a summary to its source. The goal is to establish whether the dashboard supports a repeatable operating review, not just an attractive demonstration.
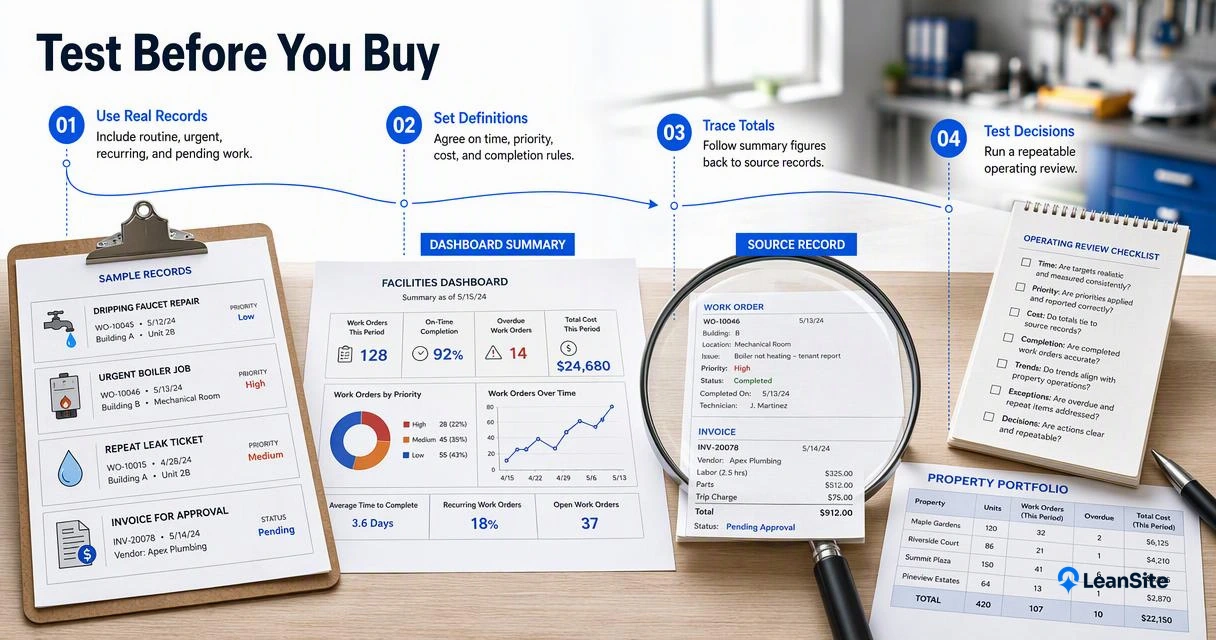
A practical four-step acceptance test
- Choose representative records: Include routine repairs, an urgent job, a recurring fault, and an invoice awaiting approval.
- Set definitions: Agree on timestamps, priorities, spending categories, and completion rules.
- Trace the totals: Reconcile dashboard figures with work orders and financial records.
- Assign follow-up: Confirm who owns each exception and when the next review occurs.
The cost of poor connectivity is relevant when assessing field updates and reporting freshness.
A spreadsheet prototype for testing requirements
A simple tracker can help establish fields and status rules before a software evaluation.
The tutorial is useful for prototyping task tracking, not evidence of enterprise dashboard capabilities.
What to watch beyond 2026
AI and digital twins are relevant areas for future dashboard evaluation, but product-specific capabilities require verification. The 2023 review Technologies for digital twin applications in construction addresses construction applications; the 2021 paper Energetics Systems and artificial intelligence addresses energy applications. Neither establishes dashboard savings benchmarks.
Future-facing features should remain traceable to source records and accountable decisions.
Conclusion
The strongest owner dashboard connects a visible exception to a clear next action. A practical next step is to shortlist platforms, prepare representative maintenance records, and request the five priority views in a demonstration. For an AI-assisted facilities workflow evaluation, owners can explore Leansite at getleansite.com and bring those same acceptance criteria.